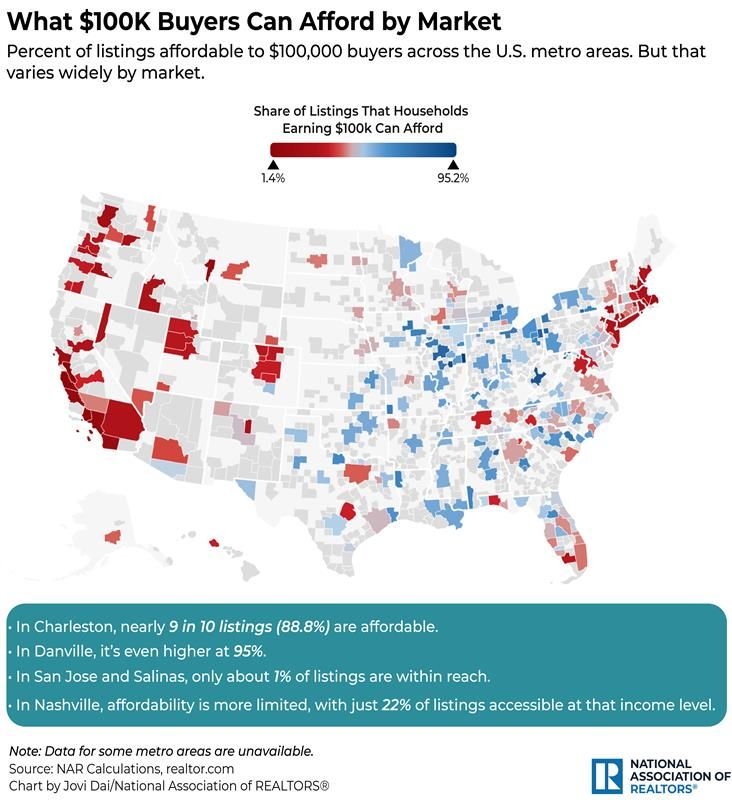
A $100K income buys very different things: nationally it affords 4 in 10 listings, but just 1% in San Jose and 88.8% in Charleston. Explore your local market and see what different income levels can afford using the Metro Market Statistics Dashboard: https://www.nar.realtor/research-and-statistics/housing-statistics/metro-market-statistics
#housingmarket #realestateaffordability #metromarketstats #realestateinsights #costofliving
#housingmarket #realestateaffordability #metromarketstats #realestateinsights #costofliving
Shared byShawn Cruz - A month ago
Log in to comment
Loading ..
Related Articles
NAR Research Presentations: Insights for REALTORS® Success
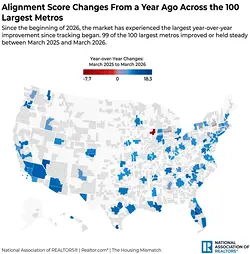
Housing Affordability Improves in 99 of 100 Largest Metros: A Detailed Report
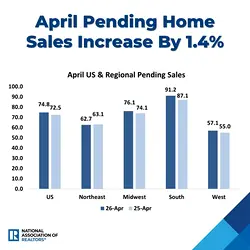
April's Pending Home Sales Surge: NAR Data Reveals 1.4% Monthly Increase
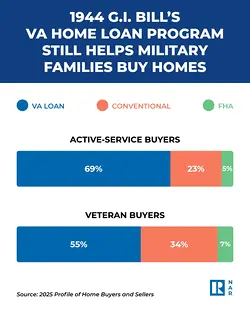
Memorial Day Tribute: Understanding Military Families' Homeownership Journey
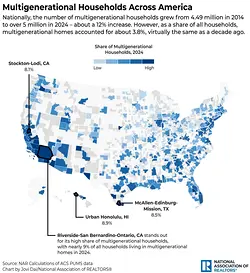
Rising Multigenerational Living Trends Amidst High Housing Costs
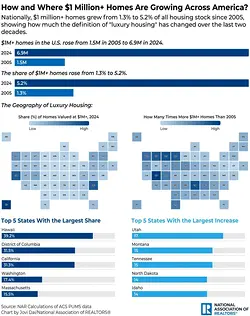
Exploring the Rise of Million-Dollar Homes in the U.S. Market
59
0/100