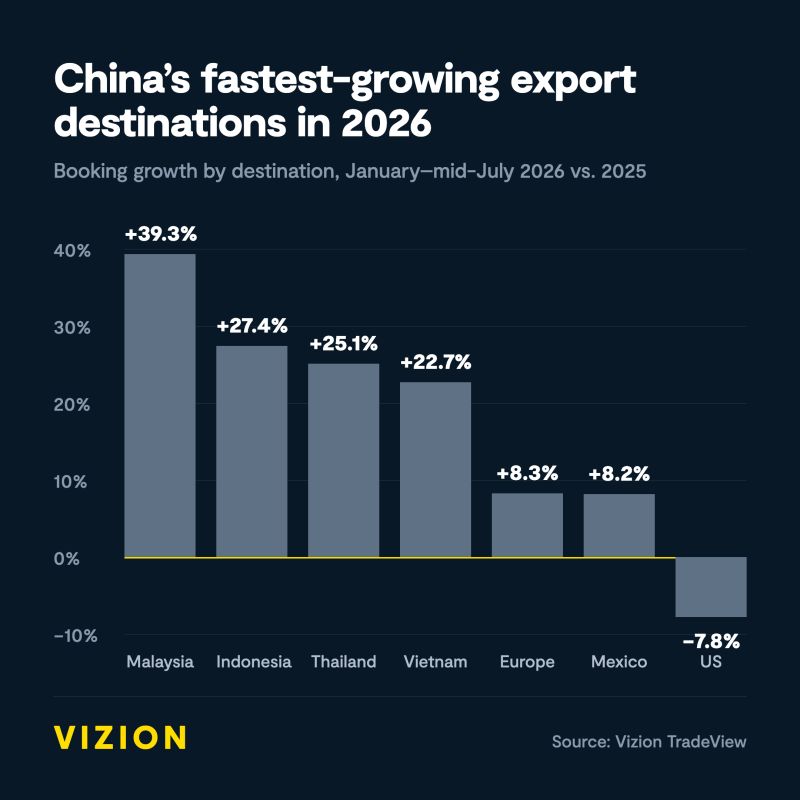

One chart, seven lanes, and the map of China's export trade redraws itself.
January to mid July 2026 vs the same period in 2025, from TradeView data:
Malaysia +39.3%
Indonesia +27.4%
Thailand +25.1%
Vietnam +22.7%
Europe +8.3%
Mexico +8.2%
US down 7.8%
The four Southeast Asian lanes combined are up 28.3%, and the pace is accelerating. Booking data shows these shifts weeks before they reach port statistics.
#supplychain #containershipping #tradedata #Chinaexports
January to mid July 2026 vs the same period in 2025, from TradeView data:
Malaysia +39.3%
Indonesia +27.4%
Thailand +25.1%
Vietnam +22.7%
Europe +8.3%
Mexico +8.2%
US down 7.8%
The four Southeast Asian lanes combined are up 28.3%, and the pace is accelerating. Booking data shows these shifts weeks before they reach port statistics.
#supplychain #containershipping #tradedata #Chinaexports
Shared byAlex Gray - 5 days ago
Log in to comment
Loading ..
Related Articles

Port of Oakland's June TEU Growth and Increased Vessel Wait Times
Impact of Tariff Changes on Brazil to US Trade: A Year in Review
Vancouver Port's Import Turnaround Hits 10.8 Days, Nearing Record Slowness

Impact of Gulf Strait Attack on Global Trade Routes

Analyzing North Europe Hub Check: June Import Data Insights
Record-Breaking Apparel Imports in June 2026: What It Means for Future Trends
1
0/100