The question we get most often: "How do we know which test to run next?"
For us, that answer is a prioritization engine built on 4,000+ documented experiments.
And it is like that because when we started we were thinking about CRO the wrong way.
Chasing individual tests.
Celebrating single wins.
Treating each experiment as its own isolated event.
Every test idea gets scored across five factors: where it runs and how many people see it, how strongly the research supports the hypothesis, implementation cost, and how similar tests have performed historically across our database.
The highest-scoring tests go first.
It sounds obvious, but most testing programs have no scoring system at all.
They have a backlog with no logic.
The result: months of development time spent on tests that had no real chance.
Early compounding opportunities missed entirely.
What happens when the system is calibrated to your brand specifically?
After six months, win rates for our clients typically reach 55–65%.
The industry average is 20–30%.
The gap isn't talent. It's the system behind the decisions.
#CRO #TestingPrioritization #Experimentation #DataDriven #TestingStrategy
Shared byCameron Chen - 11 days ago
Log in to comment
Loading ..
Related Articles
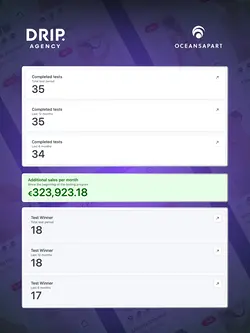
Transforming Struggles into Success: Oceansapart's CRO Journey
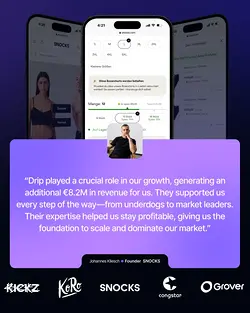
SNOCKS' €13M Revenue Growth Story: From Socks to Global DTC Giant
Boost Sales with Transparent Product Comparisons: €17K Monthly Revenue Boost

Overcome Cold Calling Stigma: Unlock New Opportunities
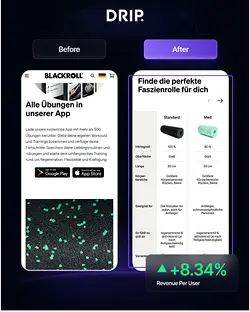
Blackroll's Global Expansion: Overcoming Challenges with Strategic CRO
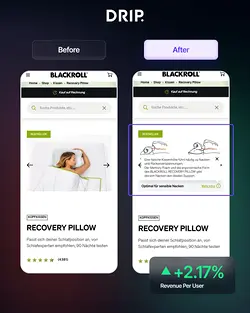
Boost Sales with Visual Proof: A Success Story with Blackroll's Recovery Pillow
1
0/100